Visualizing project tasks on a timeline can greatly aid in understanding the project flow and managing resources. If you have your project data in Excel, it's easy to convert this into a Gantt chart using Priority Matrix. Let's go step-by-step through this transformation.
Step 1: Preparing Your Excel Spreadsheet
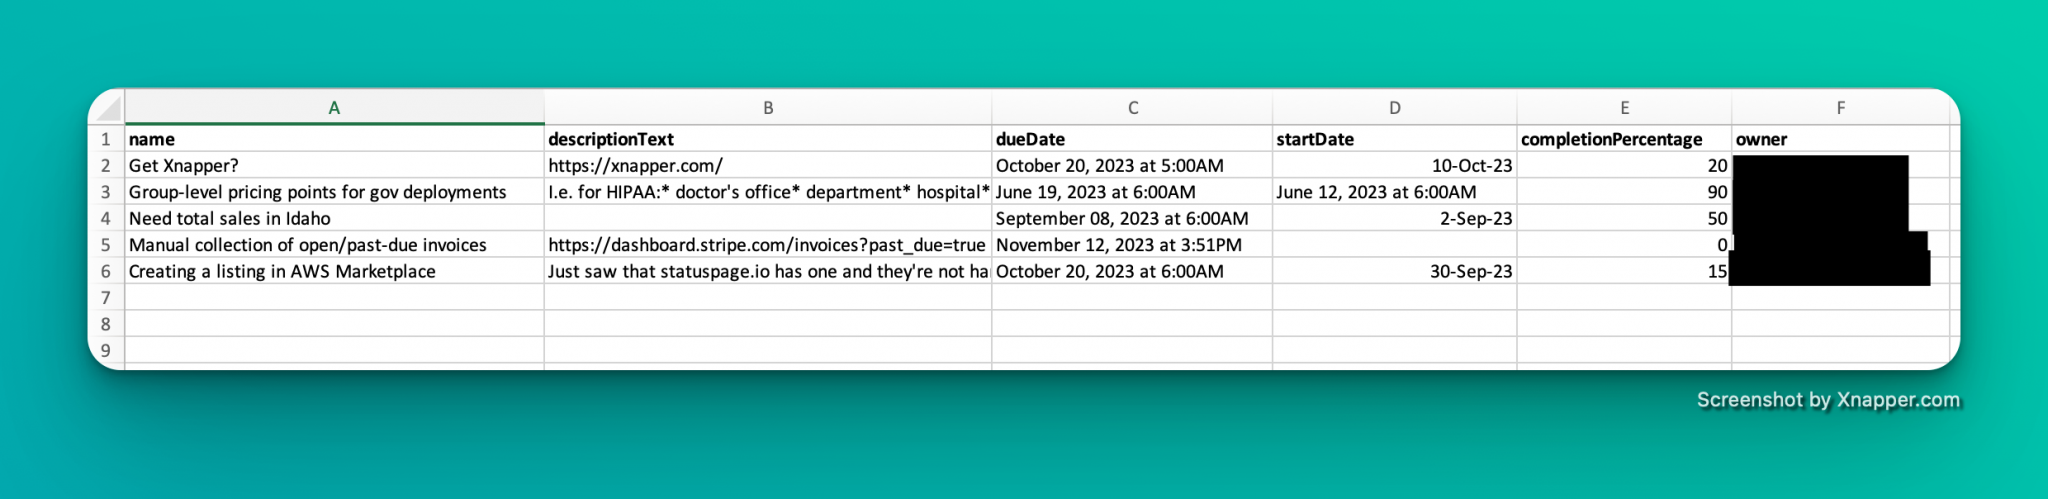
The first step is to ensure your Excel spreadsheet is structured correctly for importing into Priority Matrix. Here's a basic structure to follow:
- Column A: Task Name
- Column B: Start Date
- Column C: End Date
- Column D: Assigned To
Step 2: Importing Your Excel Spreadsheet into Priority Matrix
After your Excel spreadsheet is ready:
- Save it as a .CSV file: Click 'File' > 'Save As' and select CSV as the format.
- Open Priority Matrix.
- Go to the 'File' or 'Import' option, depending on your version.
- Select 'Import from CSV' and choose the CSV file you saved.
Step 3: Displaying Your Project as a Gantt Chart in Priority Matrix
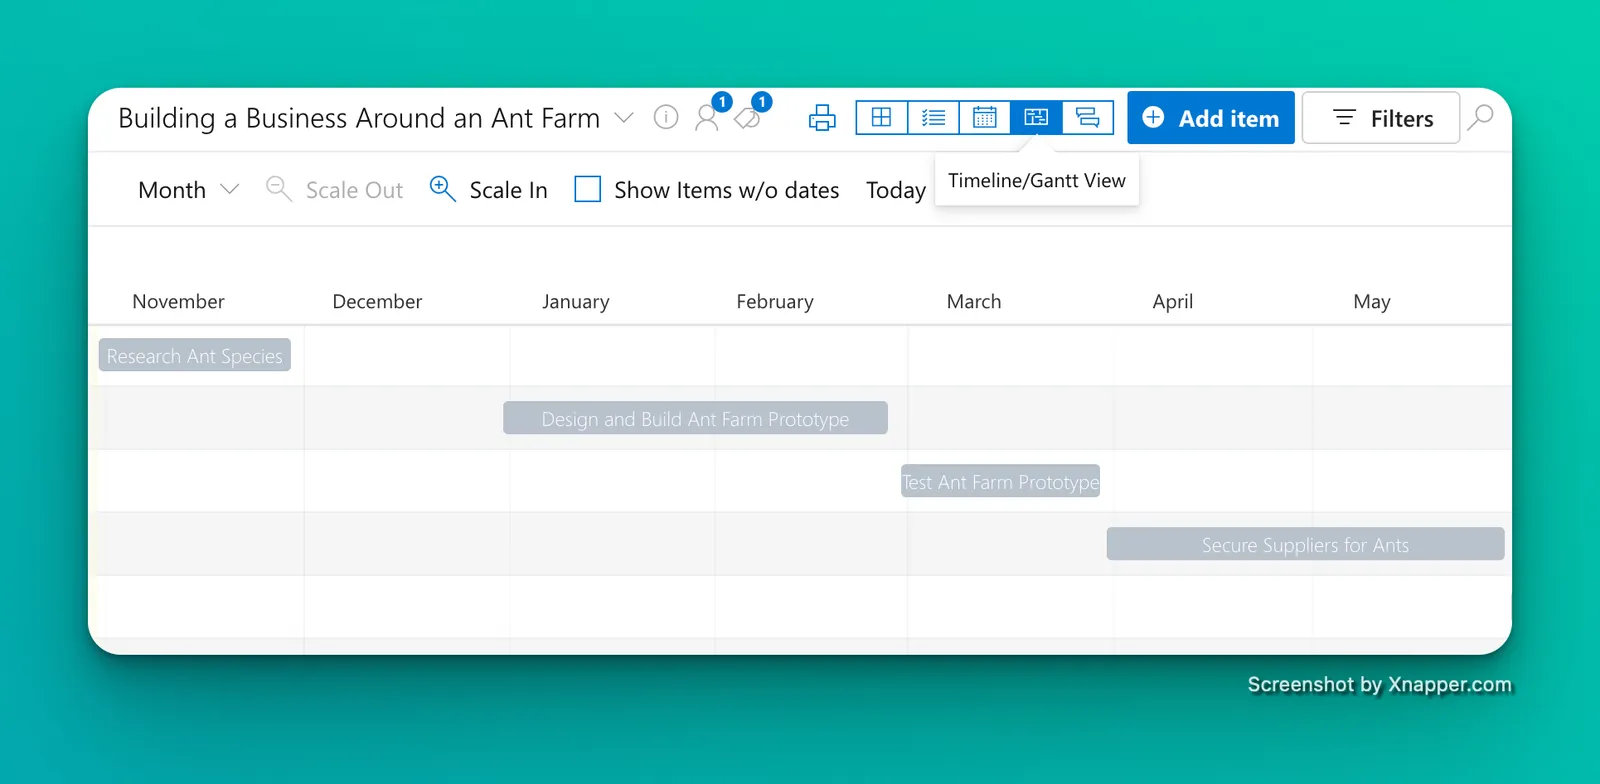
Now that your tasks are in Priority Matrix, visualizing them in a Gantt chart format is straightforward:
- Select the project containing the imported tasks.
- Click on the 'View' option or a similar menu, depending on your version.
- Select 'Timeline Mode' to view your tasks as a Gantt chart.
Conclusion
Turning an Excel spreadsheet into a Gantt chart using Priority Matrix not only organizes your tasks visually but also enhances project management. Use this feature to better track progress, allocate resources efficiently, and meet project deadlines with clarity.