When you create a Simple Gantt Chart, it provides an easy-to-follow visual path of your project schedule, which is why it's an essential tool for project managers. Some Gantt chart software even allows you to track progress right in your Gantt chart. Read on for instructions on creating a simple Gantt chart!
What Is A Gantt Chart?
A Gantt chart is a visual representation of your project schedule on a horizontal bar chart, based on task start and due dates.
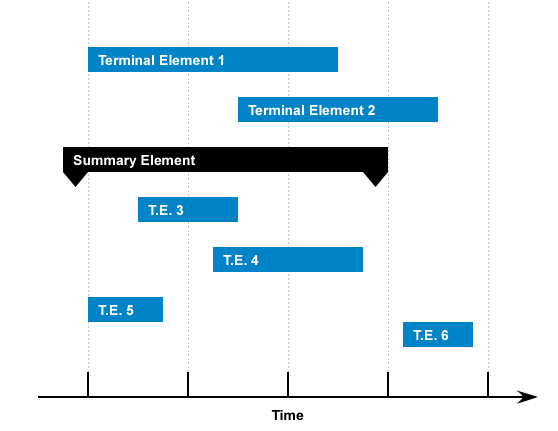
Simple Gantt charts include columns, rows, arrows, and flow drawings that direct each step of the project. This allows you to effectively track sequential milestones.
How do you create a simple Gantt Chart
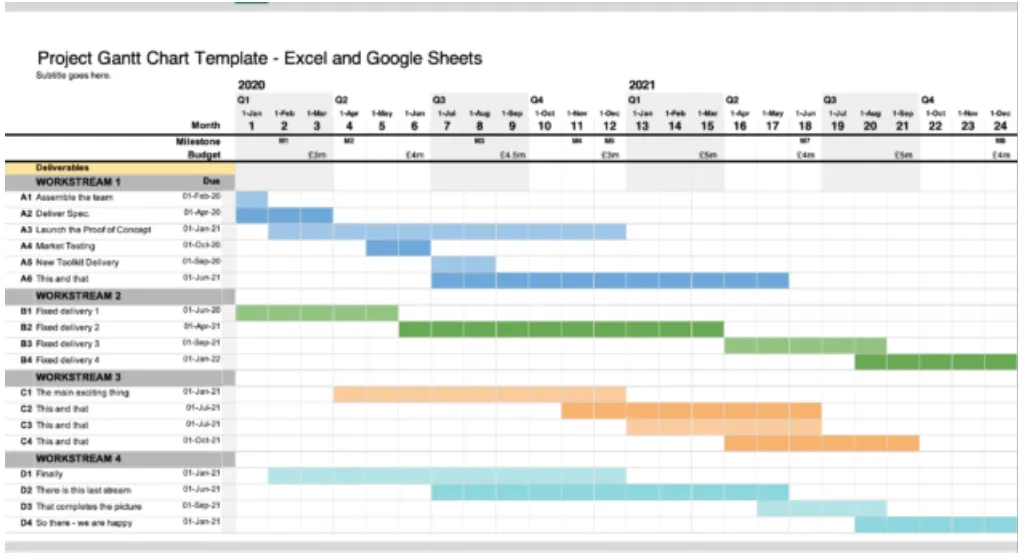
Simple Gantt charts are not super hard to create, though they might take a bit of time and effort to do correctly. Basically, all you need is a chart where the Y-axis is a list of all the tasks you've scheduled for your project, and the X-axis represents time, typically calendar days - it's that simple and straightforward.
You can do Gantt charts on paper or on your computer - excel is probably the most used basic tool for this because of its great versatility. But even on excel, Gantt charts are a bit of a hassle - downloading a template can help, but it won't save you that much time.
Project management is already a challenge, wouldn't it be great to have a tool that automatically creates and updates a Gantt chart for you?
That's exactly what we thought, which is why with Priority Matrix you can now easily create Gantt charts for your projects that match up with your needs while saving time and effort. Priority Matrix is a lightweight priority management solution that allows you to organize team tasks and timelines while building a Gantt chart for you based on the data that you input.
To build a Gantt chart on Priority Matrix, just follow these simple steps:
- List your tasks
- Assign start and end dates
- Delegate to team members, if necessary
- Click "Gantt" to access the Gantt chart
- Drag and drop within the Gantt chart to modify plans in real time
That's it! You can also modify the date range displayed in your Gantt chart, sort by team member, and display both finished and unfinished tasks. Plus, Priority Matrix is specifically built for time management and task prioritization, so the tasks and items you add will automatically appear organized accordingly.
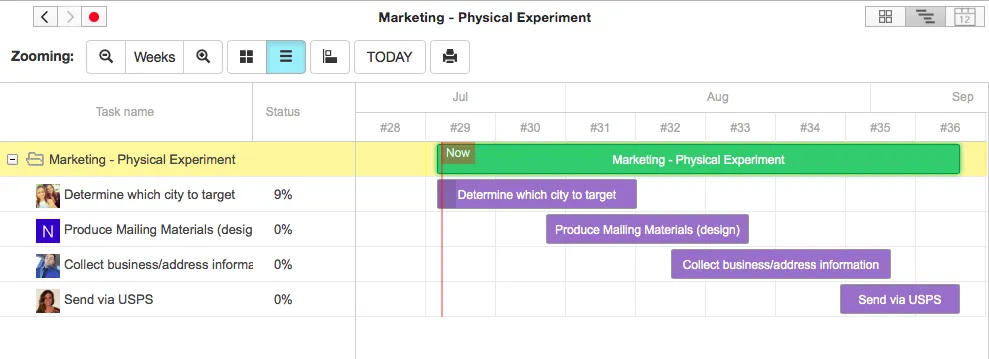
Simple Gantt Chart Example
Priority Matrix makes it easy to create and update Gantt charts. Get started with your free trial today by signing up in the box below:
Gantt Charts FAQs
How does a Gantt Chart work?
Gantt charts illustrate the tasks you have planned and scheduled for a project on a horizontal bar chart that represents time, usually in calendar days. This makes it super intuitive to assess how much time a project will take and what tasks could or would need to be done at the same time, and how long you expect them to take to complete so that you can manage and estimate your resources and time consumption correctly.
What should be included in a Gantt Chart?
The basic two variables that make a Gantt chart are scheduled tasks and time represented in days, weeks, or even months - depending on the longevity of the project. But Gantt Charts are a great way to illustrate the procedure you planned for a project, and that means including a lot more information that can be useful in order to achieve that goal. You can include as much information as you want for each task: resources, people or teams involved in a task, completion level of the task, or its priority level in comparison with other issues. You can add all this on Priority Matrix for an efficient and effective project management experience!
What are the first steps in creating a Gantt chart?
Before setting up your Gantt chart, in whatever software you want to use, comes one of the most difficult parts of project management: planning. There are many ways you can plan a project, it would be impossible for me to go over such a large topic. However, these are the basic necessary steps of planning a project that you need to do before creating your Gantt chart:
- Define and review what needs to be done, make sure there's no point unplanned in order to achieve your objectives, and set up concrete results for them.
- Create tasks or activities - break down the work that has to be done into separate tasks to achieve concrete goals that work towards the objectives you had set for yourselves.
- Organize the activities. All the tasks that need to be done must follow a logical sequence, some need to be done for the following to get started or continue moving forward towards your goal - establish the relationships between tasks and place the activities in the right order.
- Estimate the resources needed to follow through with the completion of the task. This step is necessary to have an idea of how long it will take to finish or how many of your limited resources you should use on one task.
- Estimate time - how long will a task take from start to finish? It's closely related to estimating resources: time is just another resource that restricts and limits your possibilities.
- Start drawing up the schedule. Don't try to get it right on the first try - the more complex a project, the more difficult it'll be to develop an actionable schedule. Drafting simple Gantt Charts help develop the definitive schedule you'll use for your project plan.
Gantt Charts and Project Management
Gantt charts are important tools for project management. Gantts allow you to easily map out tasks, events, and deadlines in a way that shows project timelines. Using a Gantt bar chart to layout daily, weekly, and overarching agenda items is an effective way to keep each event from getting lost or under-prioritized. Further, bar position Gantt charts let you know what needs doing and the deadline for getting it done.
In essence, a simple Gantt chart paints a visual picture of your project timeline, allowing you and your employees to grasp the project more effectively. This is especially useful if there are a lot of players on the scorecard.
When using a simple Gantt chart, you should first decide on the completion date sequence for each task. Then, after pinning down other task details such as the expertise required to complete the task, you can delegate the task to an employee.
Sometimes, completing a project may even include hiring out-of-house resources such as contract employees or providers. This may sound overwhelming, but by using a Gantt chart that denotes who is in charge of each piece of the project, you can put your mind at ease.
How can Priority Matrix simplify the planning and execution of projects?
Let’s say your business plans to unveil a new website. The target launch date is 4 weeks from the day the boss throws the project on your desk. The website’s redesign involves a number of new features, distributed across many team members.
As you create tasks in Priority Matrix, set due dates, and delegate responsibilities to team members with our 1-click delegation, our product simultaneously creates a Gantt chart for you, that you can access at any time.
Furthermore:
- Priority Matrix keeps communication lines open with our in-app chat
- Our comprehensive overviews, such as the Master View and daily report, keep everyone on track
- The app automatically keeps track of everything, so you can focus on getting things done
Simple Gantt Chart Software
Priority Matrix is available for your desktop and mobile devices, whether Mac, Windows, Android, iPad, and iPhone.
Enter your email below to try it FREE today!
