Priority Matrix Reports provide an insightful overview of project and team activity. Now, without worrying about minute details, managers, project managers, and executives can quickly understand project and team status.
In this article, we'll break down Priority Matrix reports step-by-step so you can use them to their full potential!
How to Read Priority Matrix Reports:
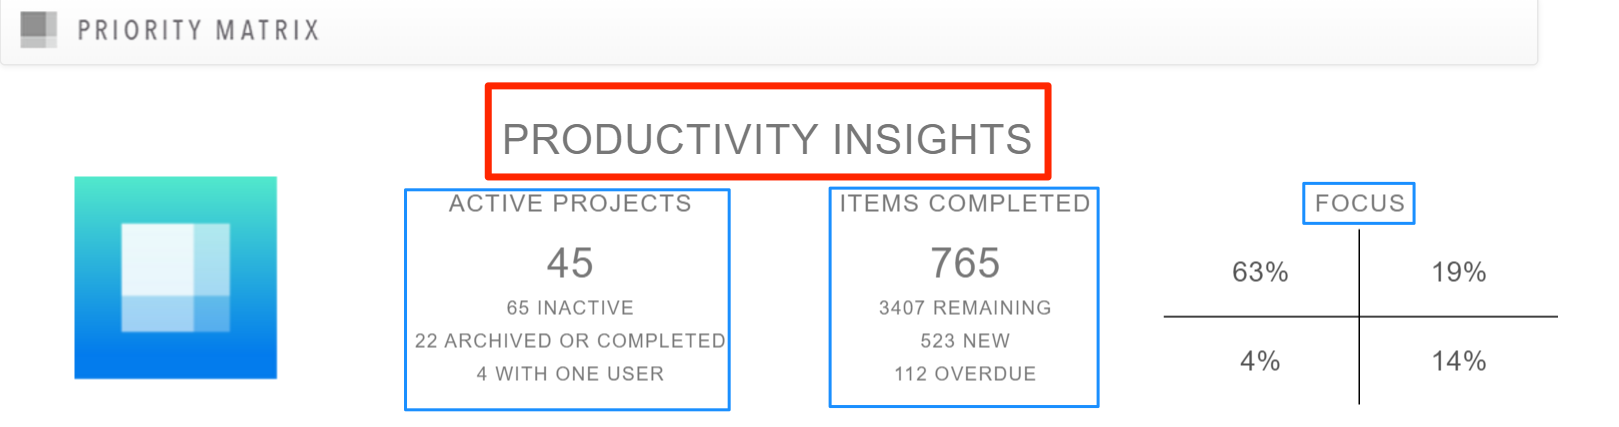
Productivity Insights:
- This will provide you with a variety of numbers, including:
- Active, inactive, archived, and completed projects
- Completed, remaining, new and overdue items
- You will also see how much focus you spend in each quadrant
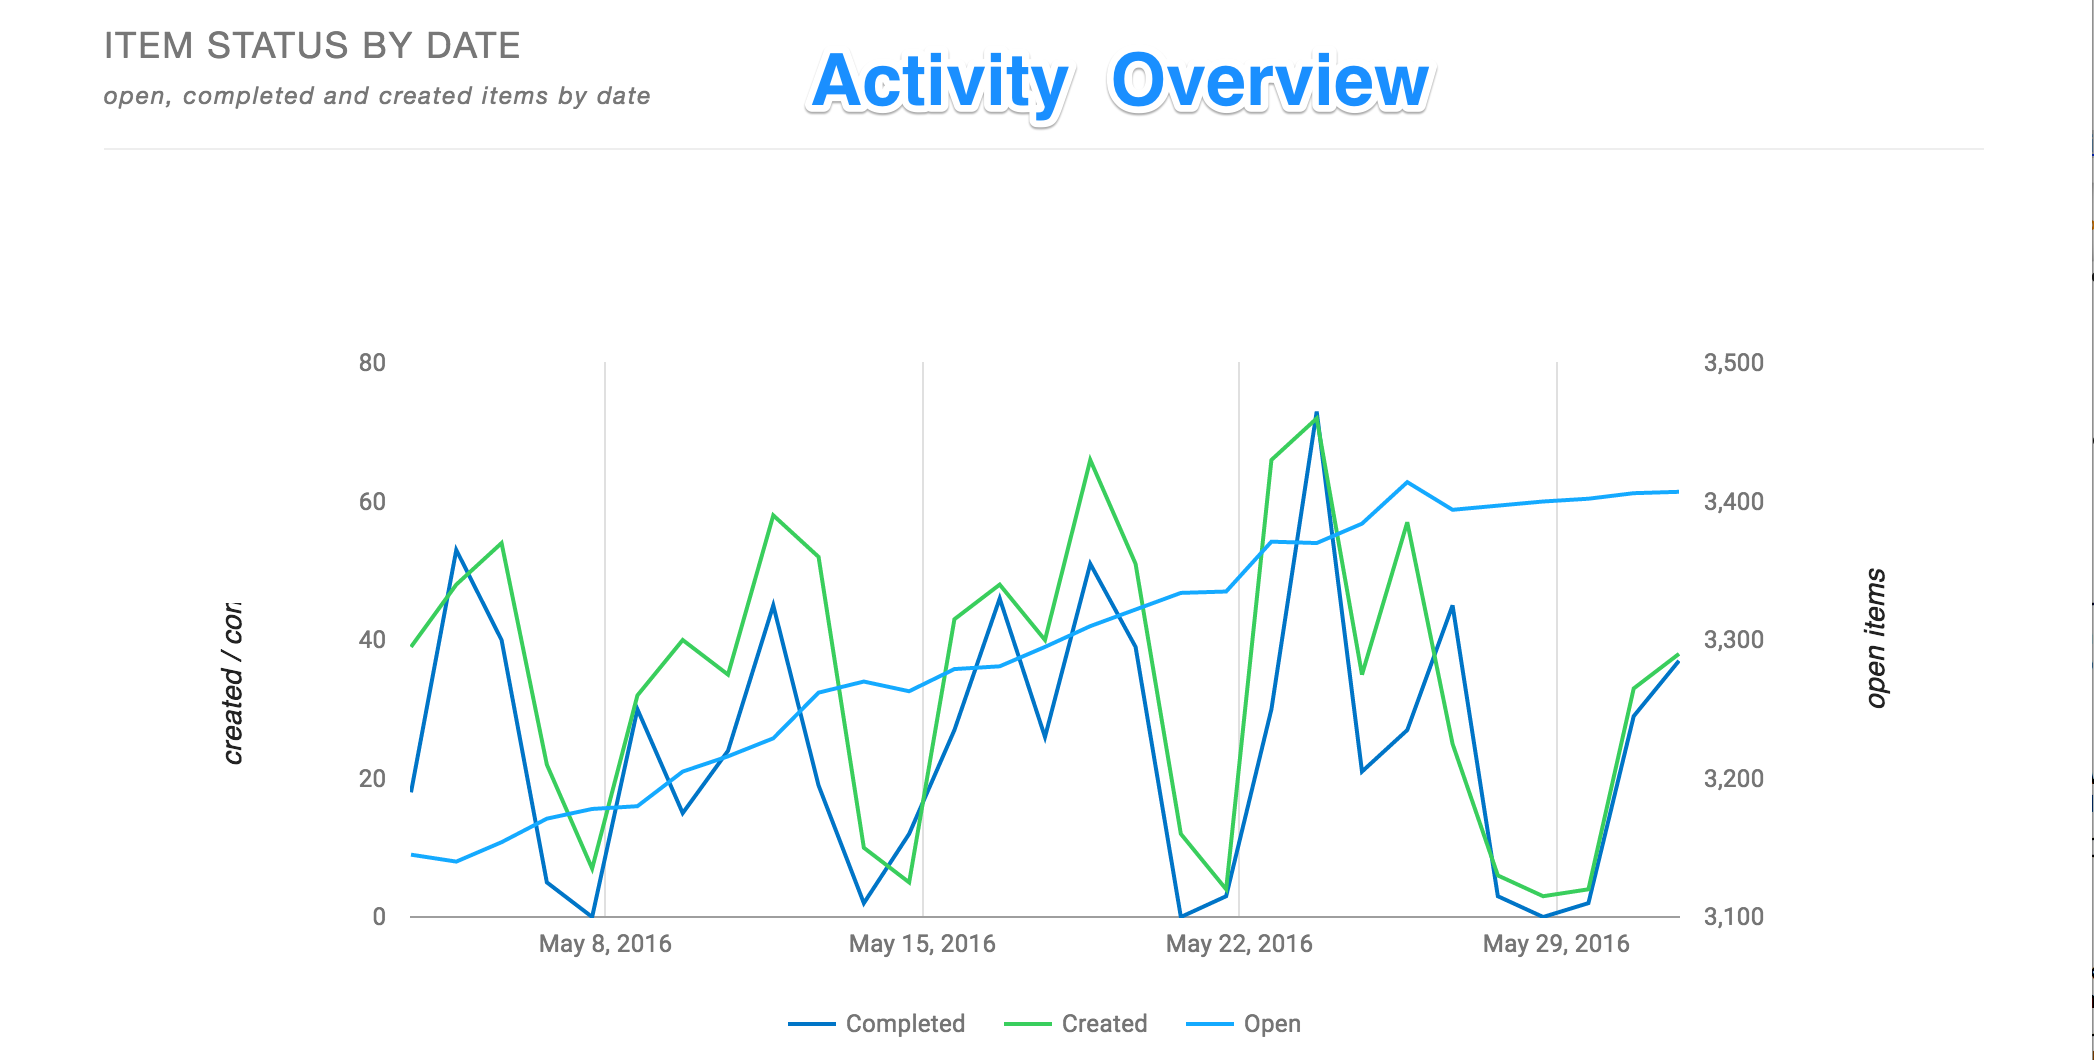
Activity Overview: Heartbeat of the team
- This will help you understand the trajectory of your work. You can see a chart of completed, created, and open projects.
- See overall progress and rhythm of your team members with respect to the bigger picture.
- A healthy balance here means that you created and completed work are on a good cadence.
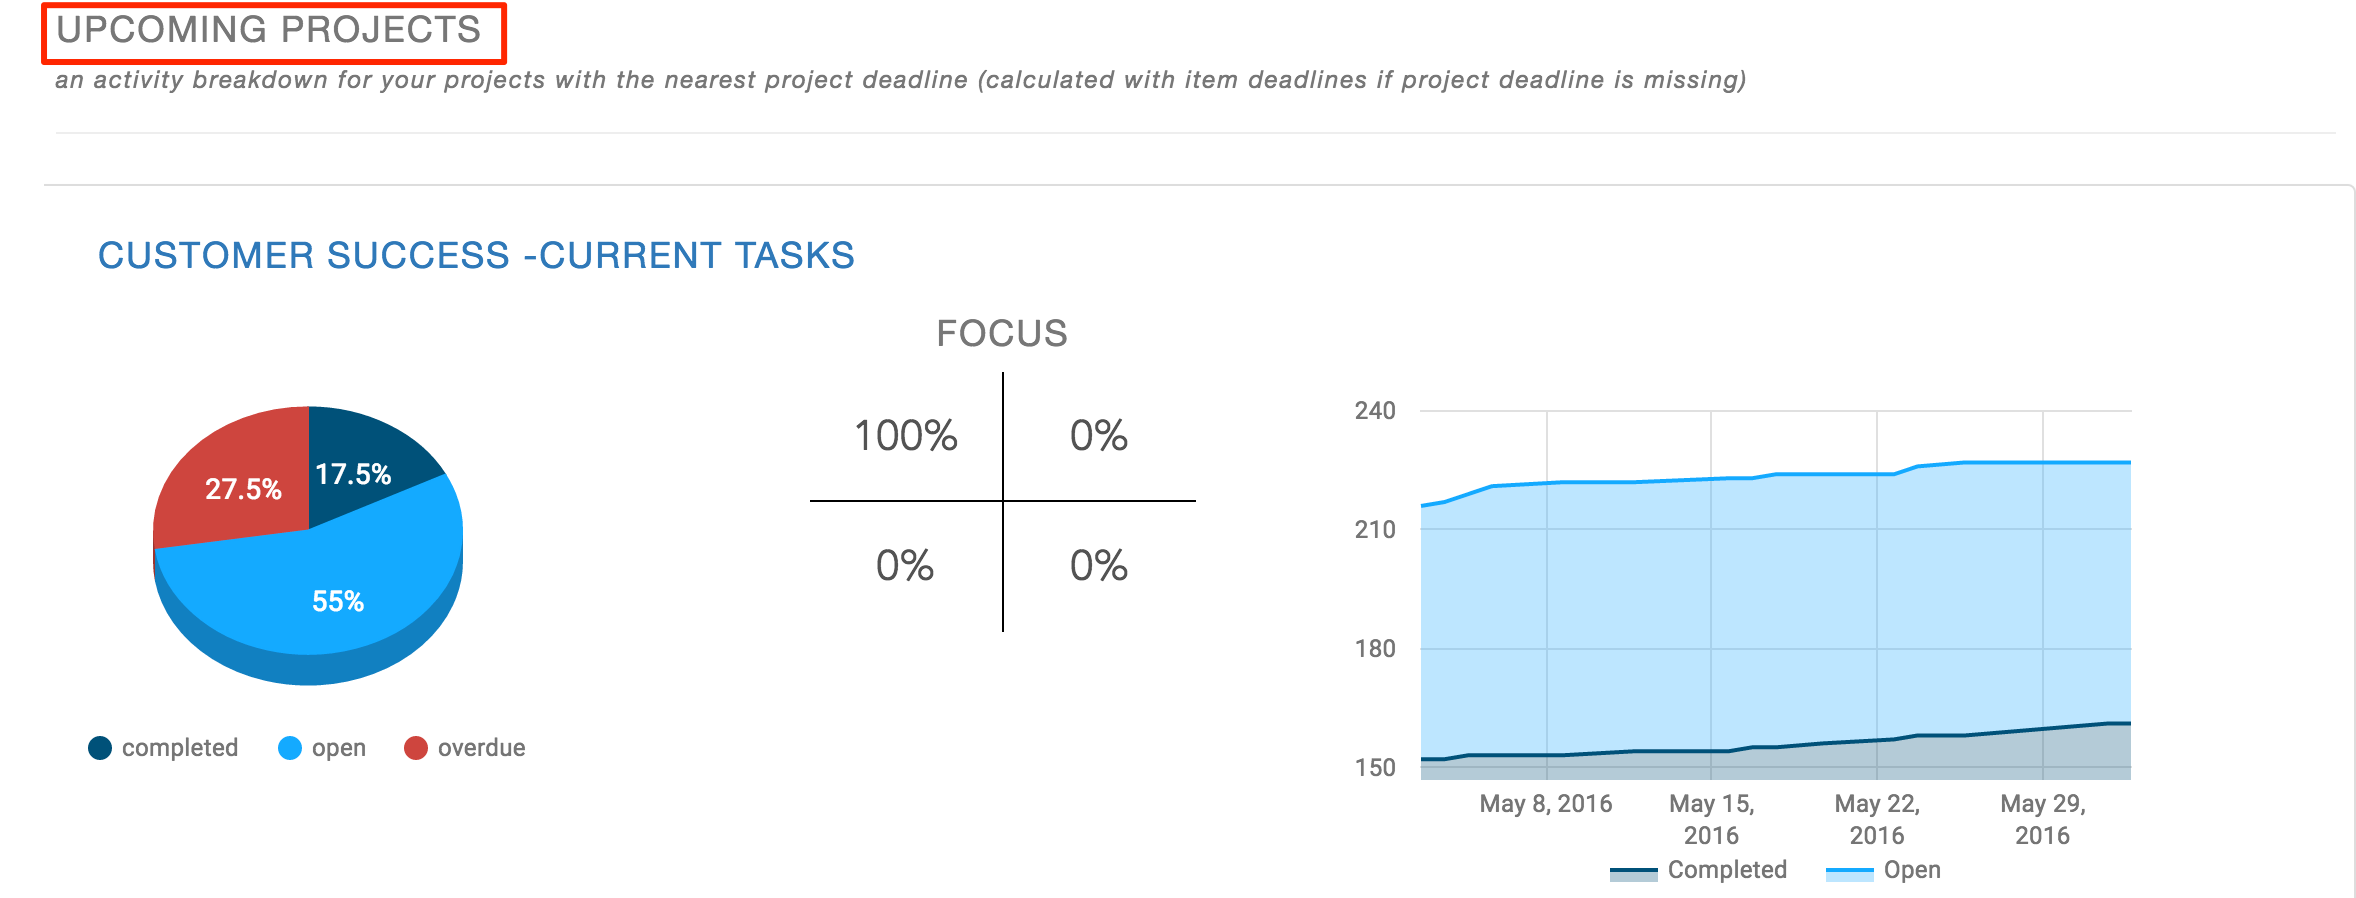
Upcoming Projects:
- This is where you will see projects that have the nearest deadlines. This section will show your three upcoming projects with most pressing deadlines.
- For each project (project title denoted in blue) you will see:
- A pie chart that shows the distribution of completed, "open," and overdue items.
- A matrix, which denotes where the majority of upcoming tasks lie, based on their priority level, and
- A graph of completed and open items. This helps you understand whether more work has been created than finished. In the example below, you can see that there are significantly more tasks created than finished.
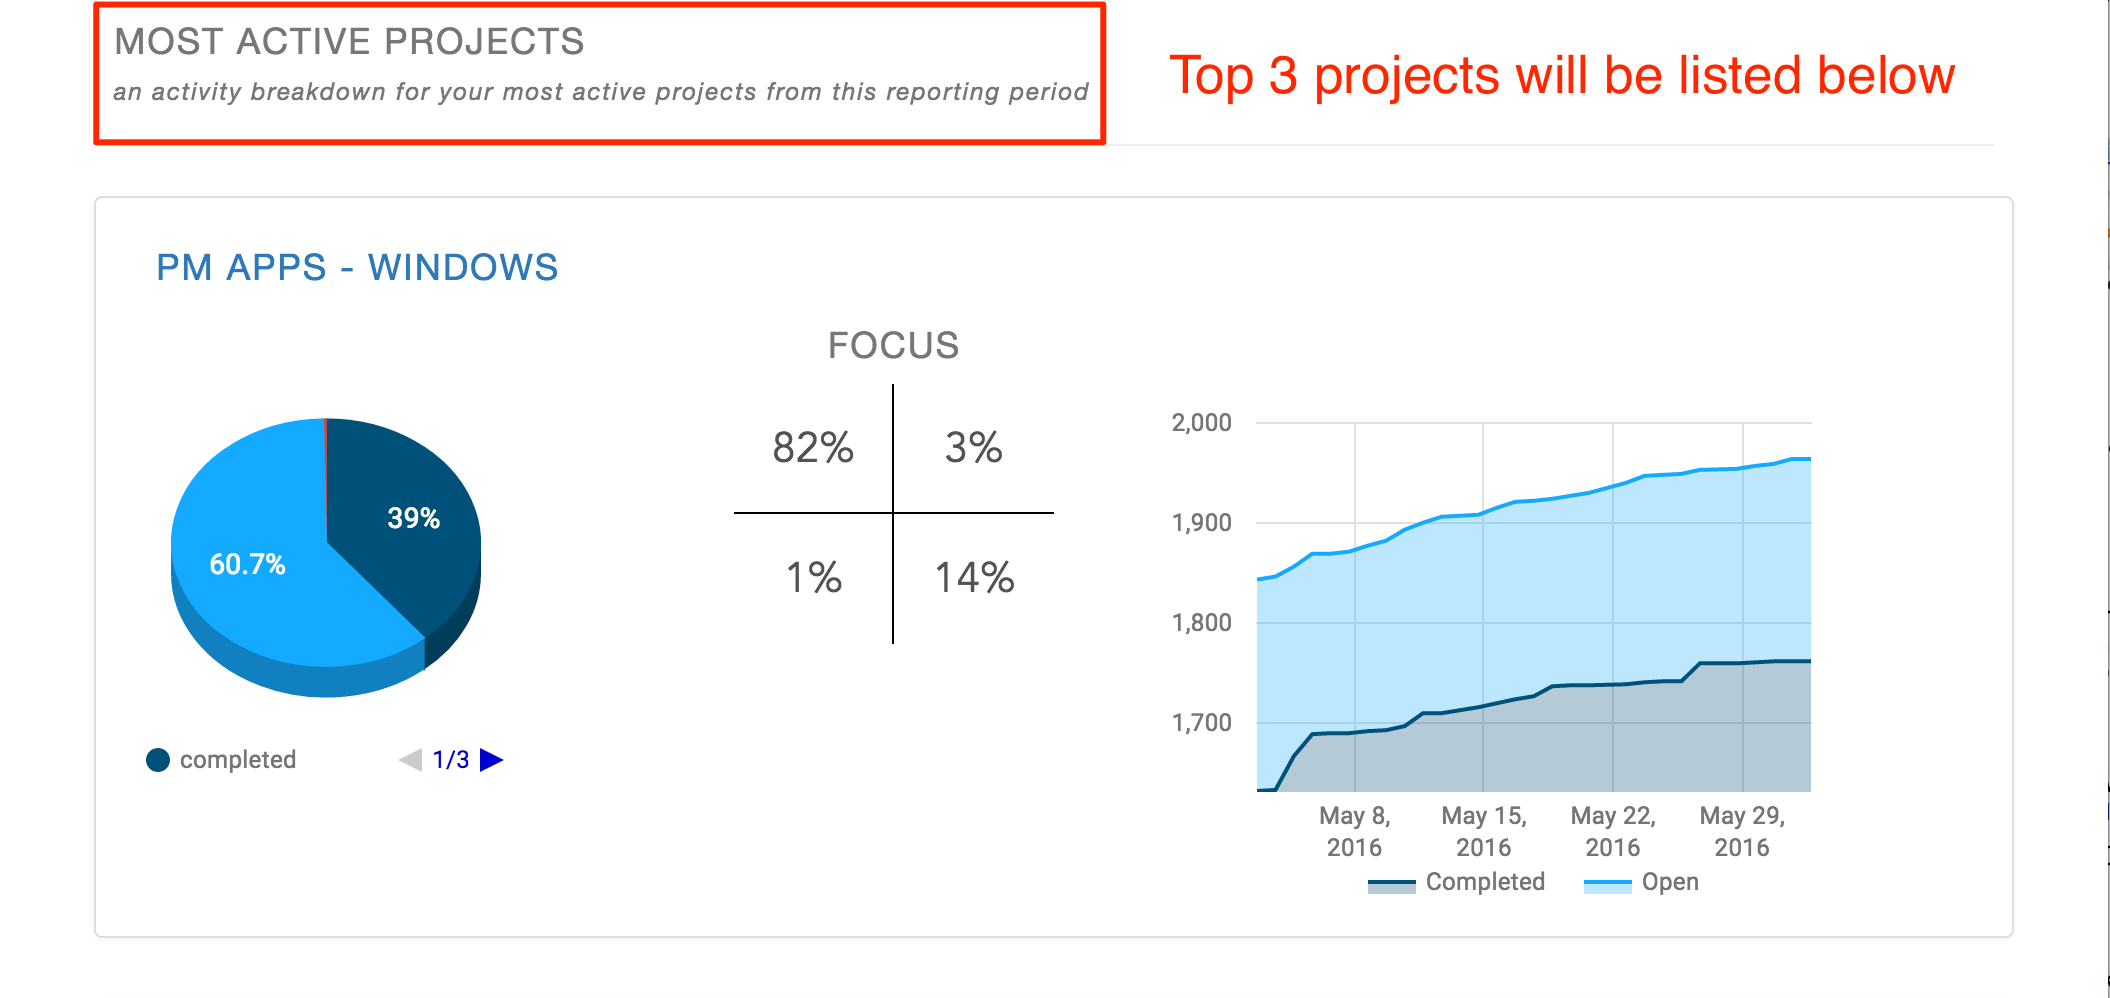
Project focus:
- This view will tell you which 3 projects you spent the most time on in the time period for which the report was generated.
- Project reports help you understand the status of each project quickly and succinctly:
- How are each of your projects, goals, or initiatives coming along? Where are people focusing their time — on high priority fire fighting, or on planning for the next big milestones? Are workloads converging or diverging?
- Finally, a graph of completed vs. open items lays to the right. In an ideal world, the amount of completed items will eventually overtake the amount of open items, meaning your project is coming to completion.
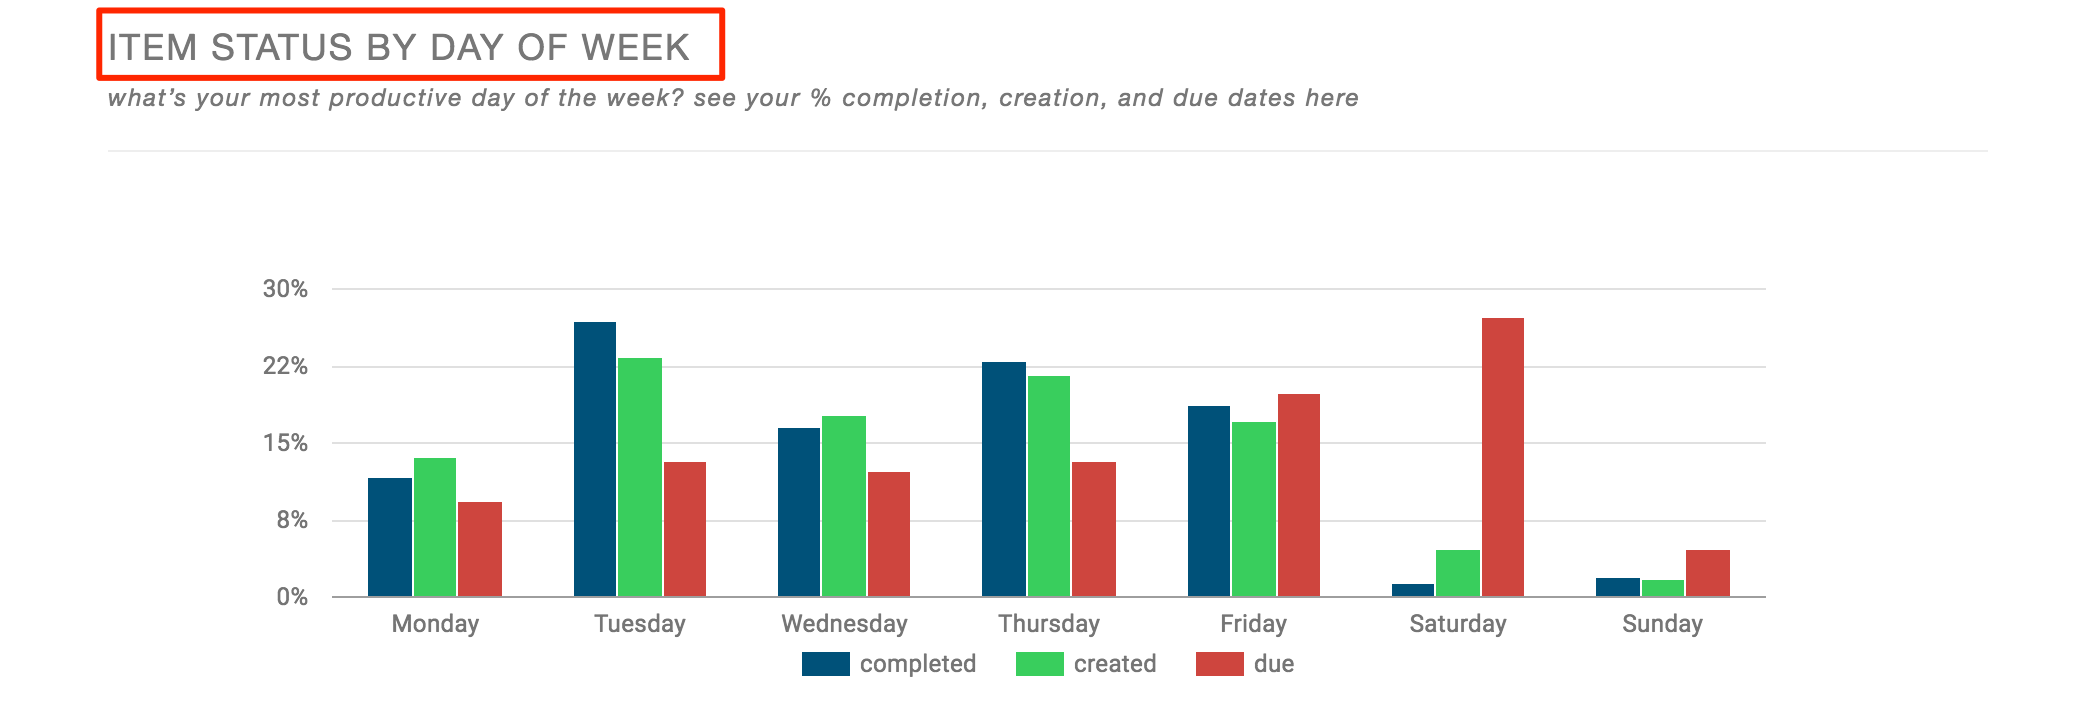
Item Activity:
- For item activity for day of the week, you will be able to understand your work style. If you think you are more productive on Mondays, then you can confirm that this is true.
- You can also see what day of the week you do the most planning (item creation) versus when you are the most productive (item completion).
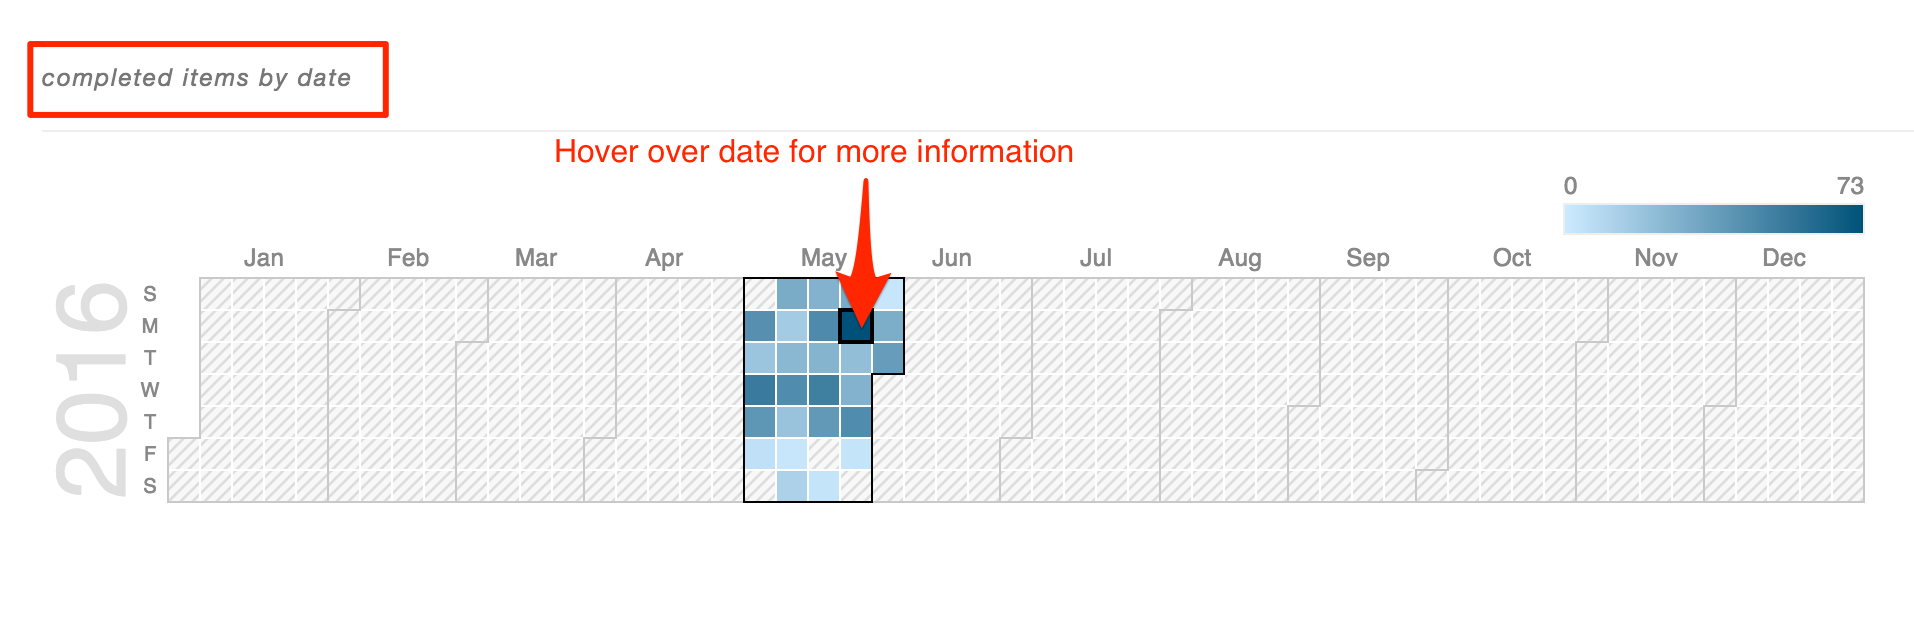
Activity Heat Map:
- This will give you a sense of when things happen on a larger scale.
- See when things happen, and why
- In the image below, for example, we see that our team was most productive on days where the blue squares are darkest.
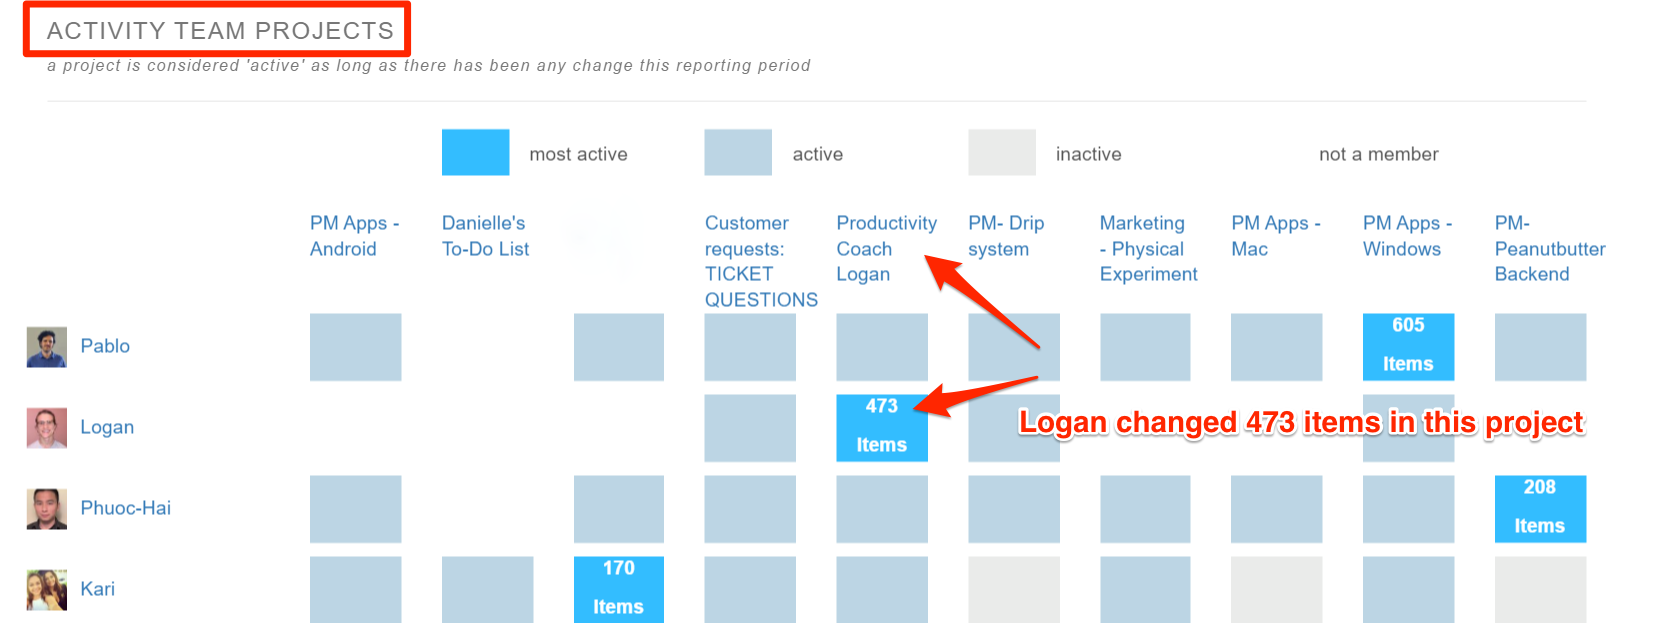
Activity Team Project:
- In this section you will be able to see who is working on each project
- Understand the relationship between projects and people
- You will also be able to see how many changes the person made in that reporting period
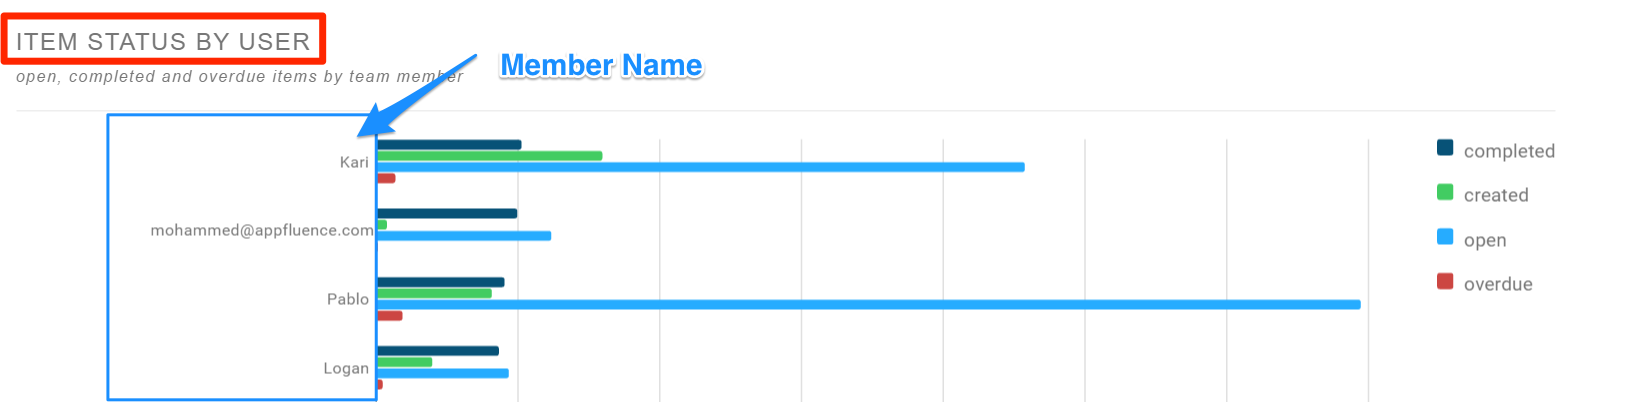
Item Status by User:
- Here, you can see how many completed, created, open, and overdue projects each person is working on.
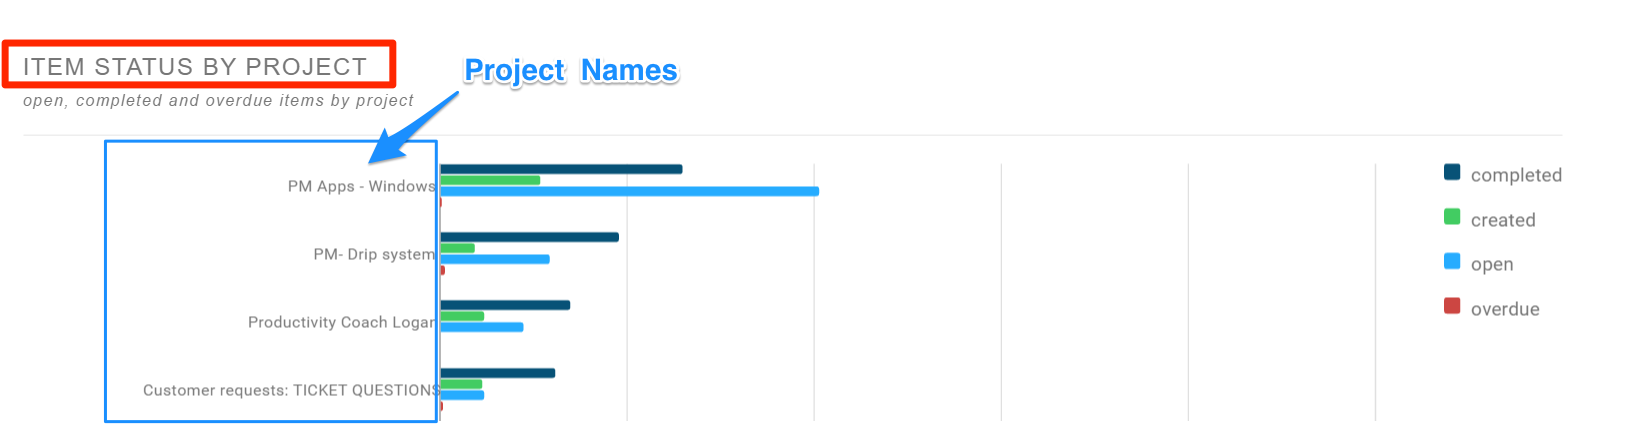
Item Status by Project:
- This will show you within each project, how many completed, created, open and overdue tasks are in each project
Priority Matrix Productivity Insights Reports can help you answer the questions that drive your company’s productivity and more. The more you use PM, the smarter it becomes.
For a PDF style explanation of the Productivity Insight Reports, check out this white paper for
Productivity Insight Reports.